Gantt Chart
How-to Guide
A Gantt chart is a type of bar chart that illustrates a schedule of tasks.
Quick Start
The following SDD gives a simple Gantt Chart.
  {
  data: {
    id: [
      '1',
      '2',
      '3',
      '4',
      '5',
      '6',
      '7',
      '8',
    ],
    group: [
      'Group 1',
      'Group 1',
      'Group 2',
      'Group 1',
      'Group 2',
      'Group 2',
      'Group 1',
      'Group 1',
    ],
    label: [
      'one',
      'two',
      'three',
      'four',
      'five',
      'six',
      'seven',
      'eight',
    ],
    start: [
      '1658514028',
      '1658730773',
      1658687938,
      '1658514028',
      1658387178,
      1658415437,
      1658391842,
      1658713417,
    ],
    series: [
      'machine a',
      'machine a',
      'machine c',
      'machine a',
      'machine b',
      'machine c',
      'machine d',
      'machine d',
    ],
    duration: [
      '428540',
      '0',
      '41860',
      '428540',
      62373,
      '63006',
      77411,
      337569,
    ],
    milestone: [
      null,
      'true',
      null,
      null,
      null,
      null,
      null,
      null,
    ],
  },
  version: '1.0.0',
  sddFormat: 'sdd/table/object-of-arrays',
  definitions: {
    id: {
      kind: 'string',
      optional: true,
    },
    group: {
      kind: 'string',
      optional: true,
    },
    label: {
      kind: 'string',
      optional: true,
    },
    start: {
      kind: 'string',
      optional: true,
    },
    series: {
      kind: 'string',
      optional: true,
    },
    duration: {
      kind: 'string',
      optional: true,
    },
    milestone: {
      kind: 'string',
      optional: true,
    },
  },
}
The SDD above uses the Duration data format. To connect the data source, go to Data property, select Duration as the Data Type. By default, the Gantt Chart accepts a Unix timestamp in milliseconds. If your data source is in seconds, specify 1000 in the Time Factor property.
Tasks are not grouped automatically. To enable Grouping display, set Series Axis -> Enable Grouping to True.
The Gantt Chart may be too short for the dashboard as it is designed to display a large amount of tasks. For a dashboard using a 2x2 grid, a Chart Height of 1000 and Element Height of 30 is a good starting point. Both of these can be specified under Display Options.
To display the labels on tasks, use the Data Labels properties.
Finally, to enable Drag and Drop, toggle Enable Drag and Drop to True under property Drag and Drop. The tasks can now be dragged freely.
Advanced Configuration
There are many features built into the Gantt Chart that can be enabled through additional configuration.
Locking
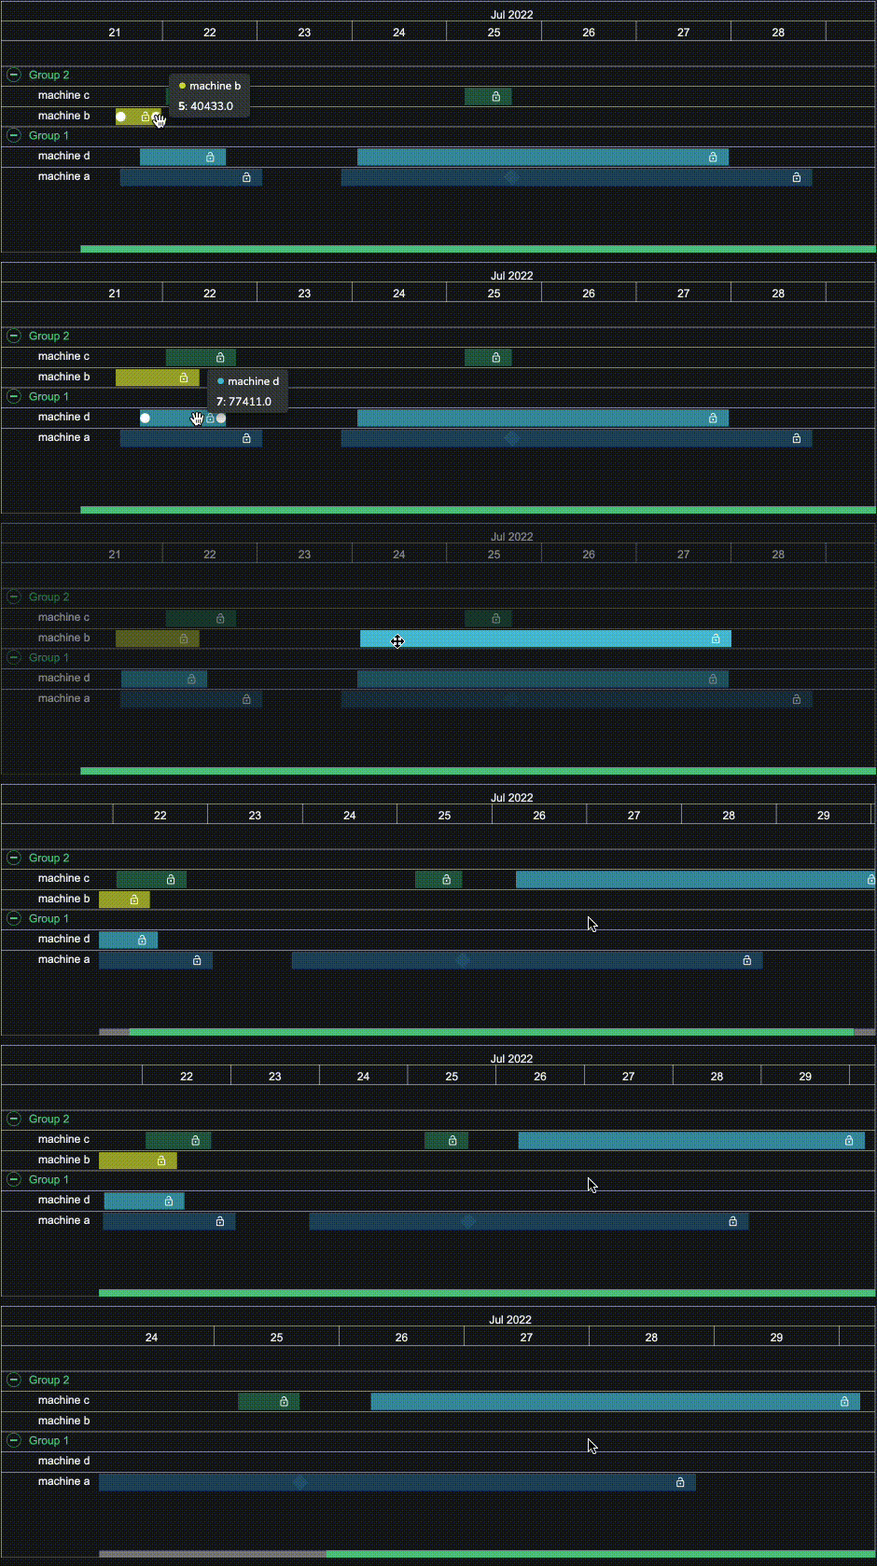
Tasks can be locked to prevent them from being edited. To specify which tasks should be locked, add a column named Lock to the task data source and set it to True for each task that should be locked.
To enforce locking, set Drag and Drop-> Enable Element Locking to True. Note that this will prevent tasks from being moved via drag and drop.
Occasionally, the user may want to change the lock status of tasks. This could be achieved by editing the data source, but there is a more interactive way to achieve the same. Under Drag and Drop, once Drag and Drop-> Enable Element Locking has been toggled to True. A small padlock will show up on each task with the current lock status once Display LockStatus for Locked Elements is turned on. Users can click on the padlock to update the status.
Select and Multiselect
Tasks can be selected on the Gantt Chart. To enable selection:
- Change the value of
Selections -> Typesto eitherSingle(for single select) orMulti(for multi-select). - Link
Selected Pointsto a variable in a data store.
When an task is selected the color of the task will be Yellow by default. A different color can be specified by changing the value under Selected Point Color. Use the Colored property to turn off highlighting.
Tasks can be dragged and dropped together when multi-select is enabled. Note, you still can not drag a locked task.
Color
By default, the Gantt Chart will assign colors to tasks based on their series.
Each task can be colored individually by providing the color code as a data source. For example, the user may wish to color tasks based on their duration or groups instead of series.
Dependency
The Gantt Chart can display dependency relationships, such as when one task has dependency on the completion of another.
To define these dependencies, you need to link from the task that needs to complete first to the task that is dependent upon its completion.

For example, in the screenshot above, task 3 is dependent upon the completion of task 6. To configure this dependency relationship:
- Create a column
dependsOnin the data. - In the data, set the
dependsOncolumn oftask 6to3(the ID oftask 3). - A line between tasks 6 and 3 will now be visible.
Uncertainty

Tasks don't always start or end at an exact time time. To show a range of possible start and end times you can specify the uncertainty associated with a task.
The following fields of a task correspond are relative to the start time. Specifying a negative value for any of them indicates a time before the task start time, while a positive value indicates a time after the start time.
uncertainStartMin(number): The earliest a task could start.uncertainStartMid(number): When a task is most likely to start.uncertainStartMax(number): The latest a task could start.
The following fields of a task correspond are relative to the end time. Specifying a negative value for any of them indicates a time before the task end time, while a positive value indicates a time after the end time.
uncertainEndMin(number): The earliest a task could finish.uncertainEndMid(number): When a task is most likely to finish.uncertainEndMax(number): The latest a task could finish.
Drag Boundary
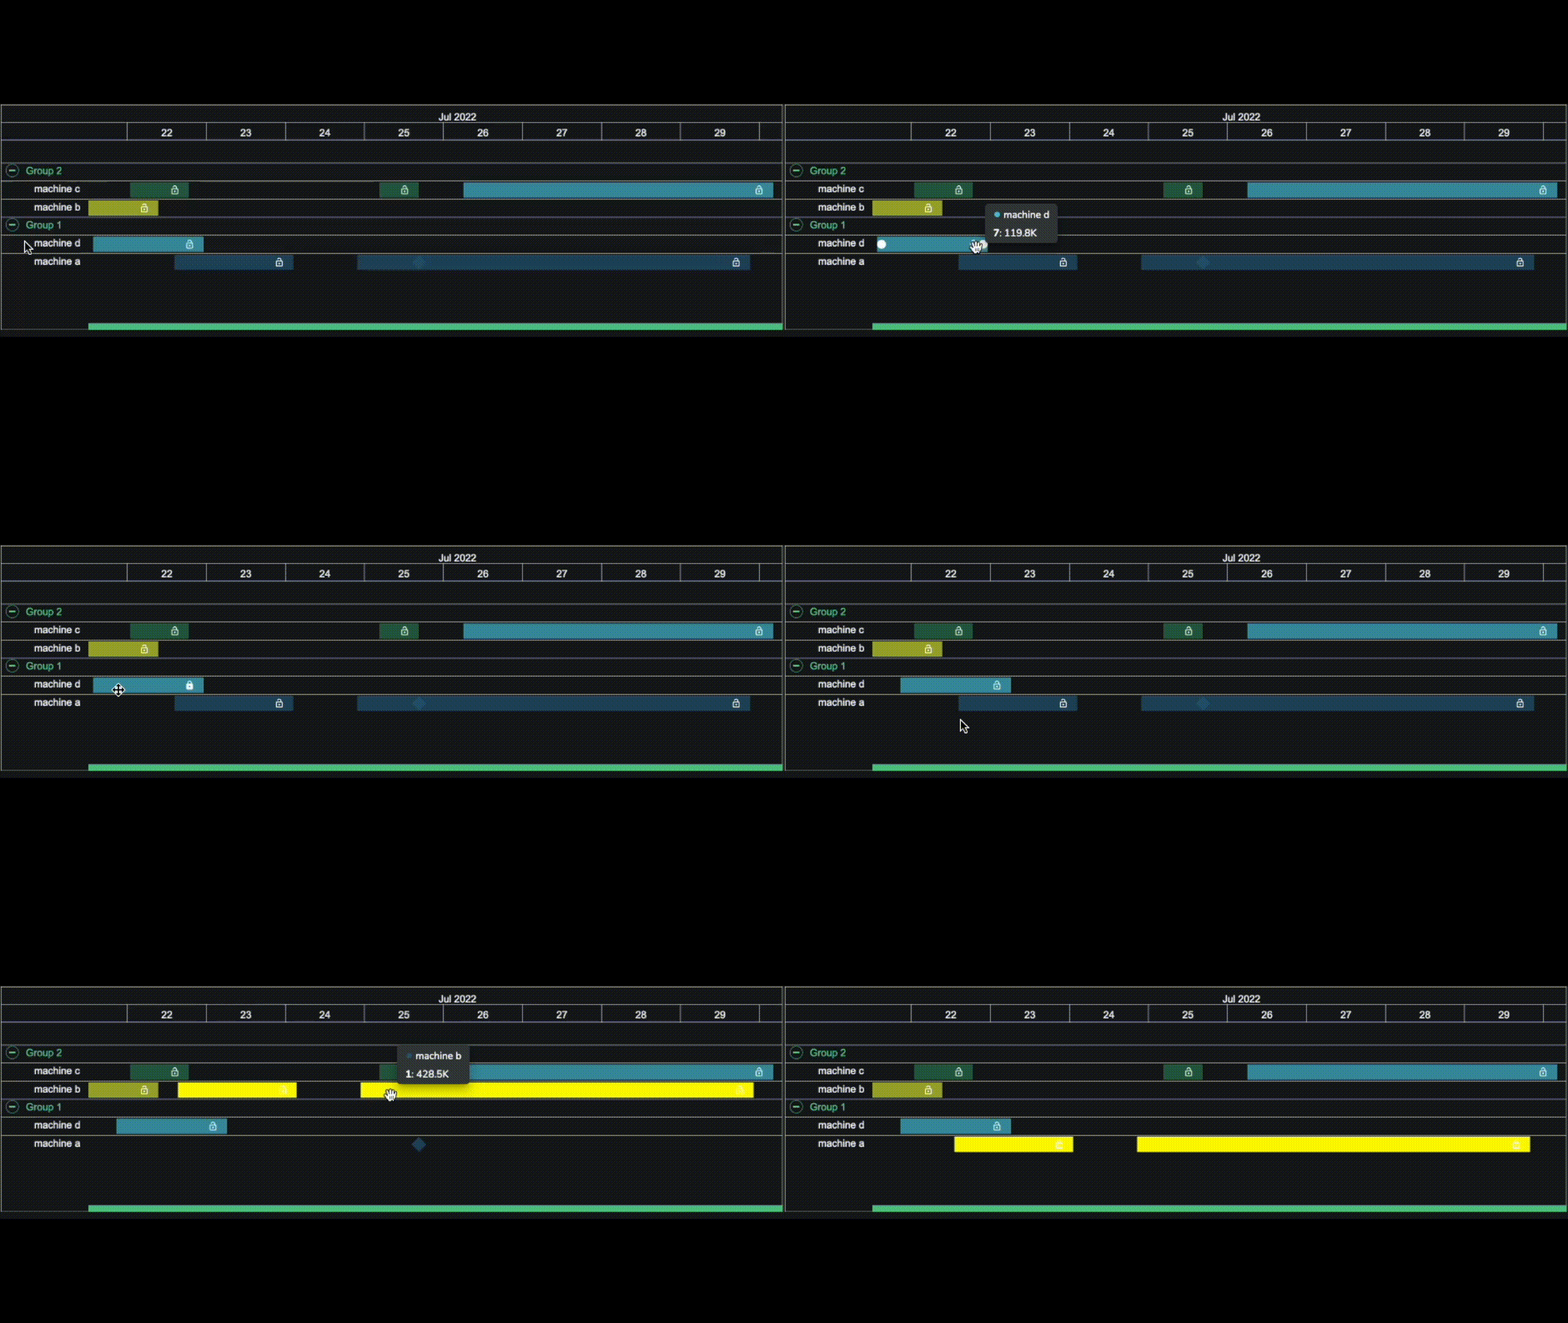
 The animation above has
 Drag Boundaries configured as follows:
- Tasks belonging to
machine aare only draggable tomachine cand vice versa. - Tasks belonging to
machine bare only draggable tomachine dand vice versa.
Any attempt to drag the tasks outside the allowed boundary will be prevented by the Gantt Chart.
Tooltip Config
By default, tooltips will show default information about a task, but it is possible to configure what is shown.
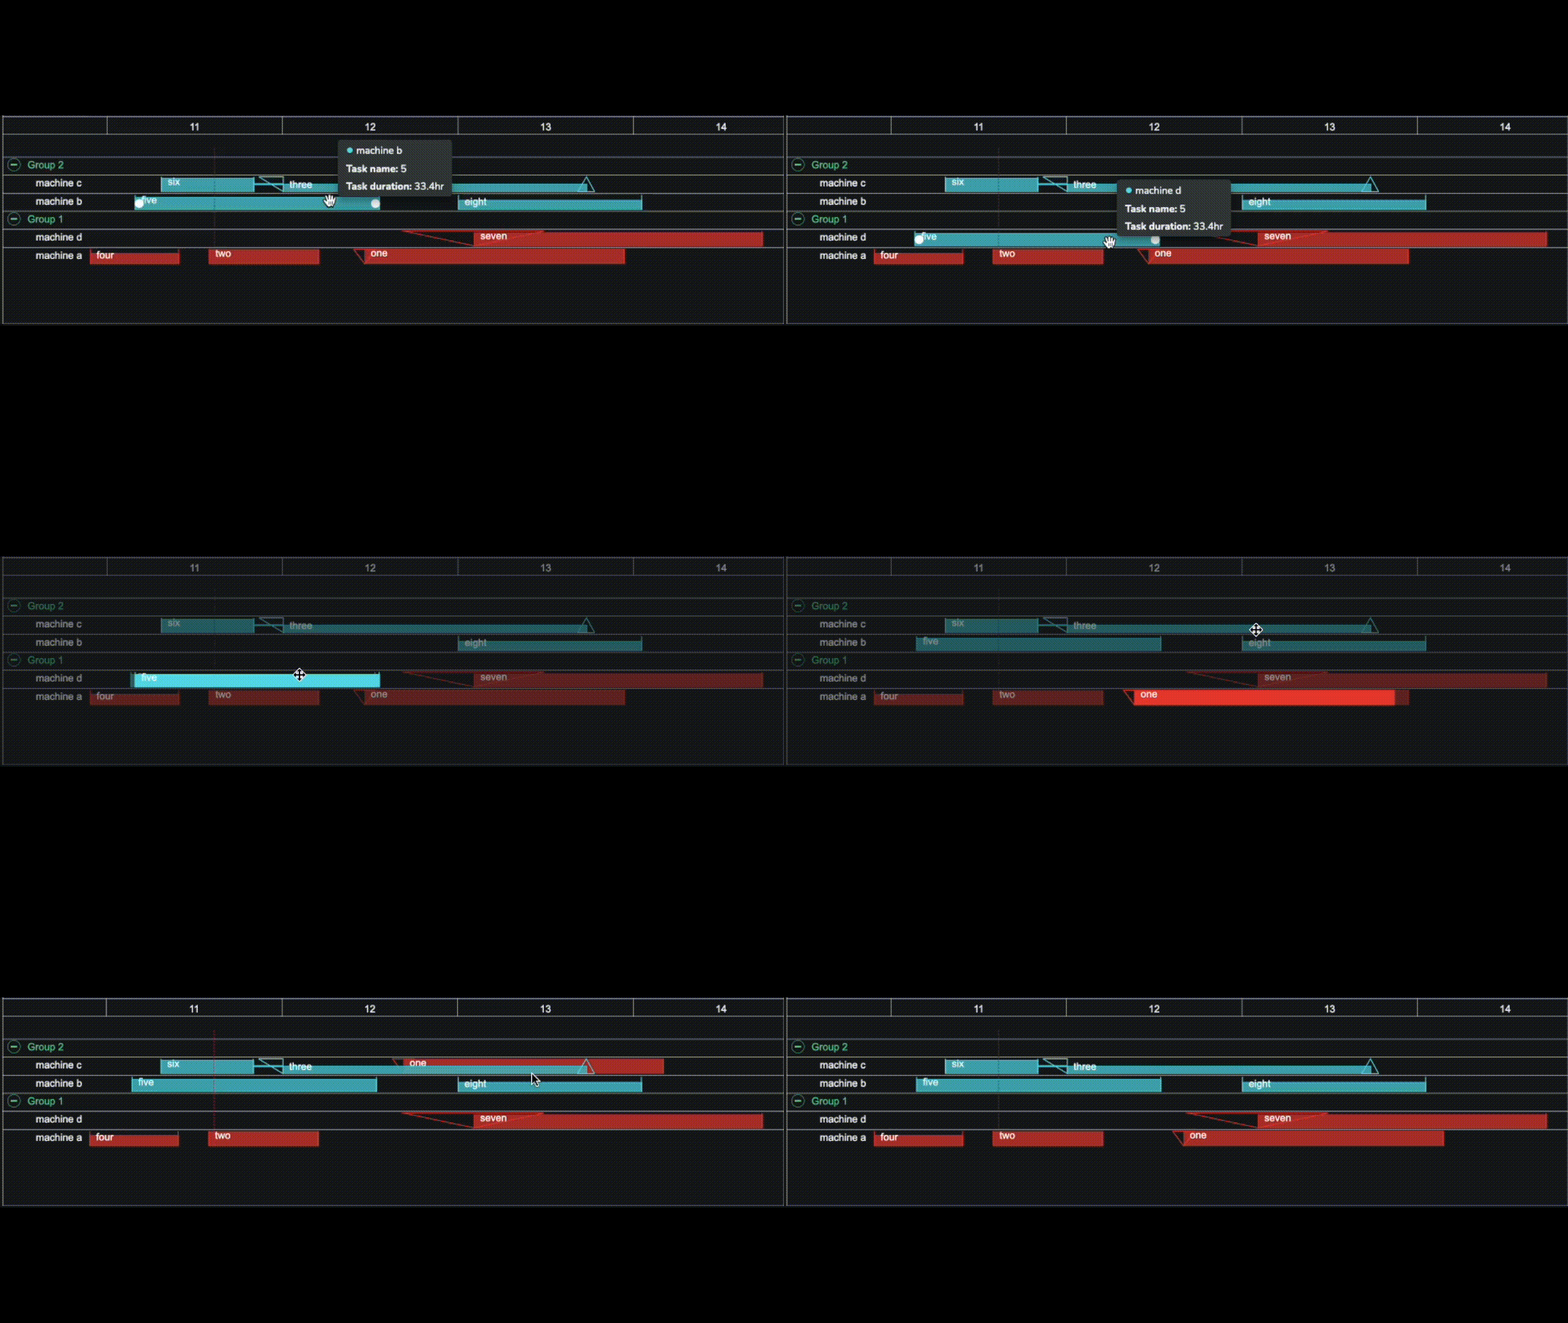
For example, the tooltips in the Gantt Chart below show the id of the task and the duration of the tasks in hours:
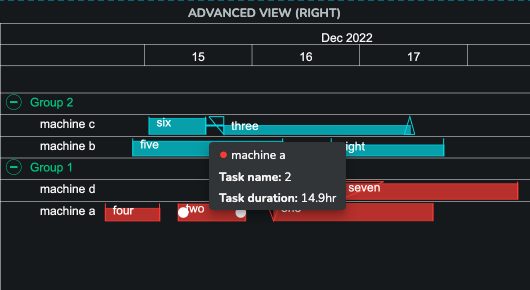
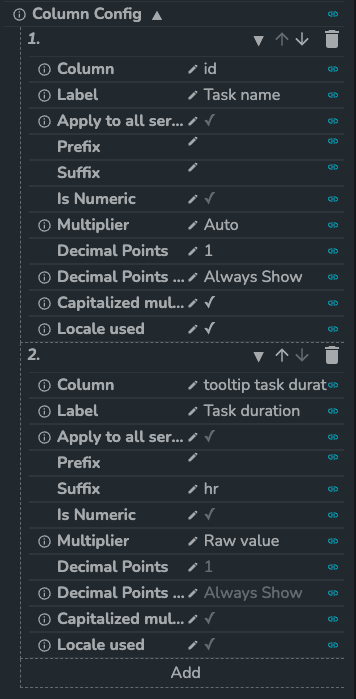
To configure this:
- Navigating to the
Tooltipsection of Gantt Chart's properties. - Disable
Show default tooltipsand expand theColumn Configsection. - Set
ColumntoidandLabeltoTask name. - Click
Addto create a second row of information for the tooltip. - Set
Columntotooltip task durationandLabeltoTask duration. - Add a suffix
hrto clearly label the unit of time as hours. (Note: In this example the tooltip task duration was derived from the actual duration using a workflow to convert milliseconds into hours).
Data Source Example
Below is an example data source that generates a Gantt that uses advanced features:
{
  data: {
    id: [
      '1',
      '2',
      '3',
      '4',
      '5',
      '6',
      '7',
      '8',
    ],
    diff: [
      '75000',
      '-1500',
      '35000',
      '-60000',
      '-38000',
      '-25000',
      '128923',
      '121228',
    ],
    color: [
      '#eb4034',
      '#eb4034',
      '#34deeb',
      '#eb4034',
      '#34deeb',
      '#34deeb',
      '#eb4034',
      '#34deeb',
    ],
    group: [
      'Group 1',
      'Group 1',
      'Group 2',
      'Group 1',
      'Group 2',
      'Group 2',
      'Group 1',
      'Group 2',
    ],
    label: [
      'one',
      'two',
      'three',
      'four',
      'five',
      'six',
      'seven',
      'eight',
    ],
    start: [
      1671126550,
      1671050050.816333,
      1671086550.816333,
      1670991550.816333,
      1671013550.816333,
      1671020018,
      1671180473.816333,
      1671172778.816333,
    ],
    Volume: [
      '300',
      '288',
      '150',
      '214',
      '250',
      '270',
      '265',
      '188',
    ],
    height: [
      100,
      96,
      50,
      71.33333333333334,
      83.33333333333334,
      90,
      88.33333333333333,
      62.66666666666667,
    ],
    locked: [
      null,
      false,
      null,
      false,
      false,
      null,
      null,
      null,
    ],
    series: [
      'machine a',
      'machine a',
      'machine c',
      'machine a',
      'machine b',
      'machine c',
      'machine d',
      'machine b',
    ],
    duration: [
      127753,
      53742,
      149242,
      43412,
      120168,
      45380,
      141737,
      90099,
    ],
    dependsOn: [
      null,
      null,
      '',
      '',
      null,
      '3',
      null,
      null,
    ],
    lineStyle: [
      null,
      null,
      'Solid',
      'Dashed',
      null,
      null,
      null,
      null,
    ],
    draggableTo: [
      {
        'Group 1': [
          'machine a',
        ],
        'Group 2': [
          'machine c',
        ],
      },
      {
        'Group 1': [
          'machine a',
        ],
        'Group 2': [
          'machine c',
        ],
      },
      {
        'Group 1': [
          'machine a',
        ],
        'Group 2': [
          'machine c',
        ],
      },
      {
        'Group 1': [
          'machine a',
        ],
        'Group 2': [
          'machine c',
        ],
      },
      {
        'Group 1': [
          'machine d',
        ],
        'Group 2': [
          'machine b',
        ],
      },
      {
        'Group 1': [
          'machine a',
        ],
        'Group 2': [
          'machine c',
        ],
      },
      {
        'Group 1': [
          'machine d',
        ],
        'Group 2': [
          'machine b',
        ],
      },
      {
        'Group 1': [
          'machine d',
        ],
        'Group 2': [
          'machine b',
        ],
      },
    ],
    uncertaintyEndMax: [
      0,
      null,
      -4300,
      null,
      null,
      0,
      null,
      null,
    ],
    uncertaintyEndMid: [
      0,
      null,
      0,
      null,
      null,
      0,
      null,
      null,
    ],
    uncertaintyEndMin: [
      0,
      null,
      4000,
      null,
      null,
      0,
      null,
      null,
    ],
    uncertaintyStartMax: [
      5400,
      null,
      null,
      null,
      null,
      0,
      '34411.1373',
      null,
    ],
    uncertaintyStartMid: [
      0,
      null,
      0,
      null,
      null,
      0,
      null,
      null,
    ],
    uncertaintyStartMin: [
      -5401,
      null,
      '12000',
      null,
      null,
      0,
      '-34400.1373',
      '',
    ],
    'tooltip task duration': [
      35.48694444444445,
      14.928333333333333,
      41.45611111111111,
      12.05888888888889,
      33.38,
      12.605555555555556,
      39.37138888888889,
      25.0275,
    ],
  },
  version: '1.0.0',
  sddFormat: 'sdd/table/object-of-arrays',
  definitions: {
    id: {
      kind: 'string',
      optional: true,
    },
    diff: {
      kind: 'string',
      optional: true,
    },
    color: {
      kind: 'string',
      optional: true,
    },
    group: {
      kind: 'string',
      optional: true,
    },
    label: {
      kind: 'string',
      optional: true,
    },
    start: {
      kind: 'number',
      optional: true,
    },
    Volume: {
      kind: 'string',
      optional: true,
    },
    height: {
      kind: 'number',
      optional: true,
    },
    locked: {
      kind: 'string',
      optional: true,
    },
    series: {
      kind: 'string',
      optional: true,
    },
    duration: {
      kind: 'string',
      optional: true,
    },
    dependsOn: {
      kind: 'string',
      optional: true,
    },
    lineStyle: {
      kind: 'string',
      optional: true,
    },
    draggableTo: {
      kind: 'string',
      optional: true,
    },
    uncertaintyEndMax: {
      kind: 'number',
      optional: true,
    },
    uncertaintyEndMid: {
      kind: 'number',
      optional: true,
    },
    uncertaintyEndMin: {
      kind: 'number',
      optional: true,
    },
    uncertaintyStartMax: {
      kind: 'string',
      optional: true,
    },
    uncertaintyStartMid: {
      kind: 'string',
      optional: true,
    },
    uncertaintyStartMin: {
      kind: 'string',
      optional: true,
    },
    'tooltip task duration': {
      kind: 'number',
      optional: true,
    },
  },
}
Settings Panel
In top left corner you can find a cog icon. After clicking on it it will open Settings Panel.
By default you can find there these properties:
Disable resize- you can temporarily disable element resize.Label font size- allows to temporarily change label font size.
Other options may be available based on configuration.
Another cog click will close settings panel.
Add/delete elements and presets
To be able to add and remove elements you'll need to use 3 properties:
Allow Add Elements- set to true, this property enables whole mechanismAdd Presets- It's an array of elements, wherelabelis rendered on dropdown list of preset.Sample preset data:
[{ label: 'one', duration: 10000}, { label: 'two', duration: 2000 }]Allow Delete Elements- it's an optional property which when set to true allows removing selected elements
Once above properties are set you can find a dropdown with presets and Add Element button in Settings Panel.
Clicking on Add Element closes settings panel and puts chart in special state. Clicking anywhere within chart domain will add new element based on the preset data and clicked position (series and start).
To delete an element - simply click on it to select it (Select properties must be configured), open Settings Panel and click on Delete Selected.
Additional Resources
There are more resources available for the Gantt Chart component, including:
- Technical Documentation - See the Technical Reference Guide for more information.
- App Templates - There are two app templates available that demonstrate the use and configuration of a Gantt Chart.